Vanity Metrics: Why Startups Should Ignore Them
This post explains why startups must differentiate between vanity and actionable metrics. Learn what to ignore and what truly drives progress and revenue.

Vanity Metrics: Why Startups Should Ignore Them
A while back, Eric Ries published a post about vanity metrics. He focused mainly on how media can trick entrepreneurs into making the wrong conclusions about their startups using flawed reporting. He also mentioned that as a startup entrepreneur, one should focus only on actionable metrics. As an entrepreneur myself, I have given this a lot of thought and I realized that this is a concept that I have been following for quite some time. In this post, I will talk about the different types of vanity metrics, why we should ignore them and finally some examples of vanity metrics.
The reason startups should avoid vanity metrics is simple, but sobering: the metrics that are easiest to grow aren't the ones that are most valuable.
Followers, impressions, signups, pageviews, app downloads, even leads in a spreadsheet; they all grow relatively quickly, look good to other people and give you something to point to in the short term.
Momentum is not progress unless it changes your next action.
Vanity metrics are satisfying because they are quick, popular, and make for a simple slide to send to your client, supplier, or board. I’ve seen a post go viral and make a team feel like they hacked their growth, but then the leads didn’t convert, repeat business didn’t lift, and the finances stayed stressed. The issue isn’t that vanity metrics are meaningless, it’s just that they’re typically bad planning tools. They don’t tell you what’s driving revenue, what kind of messaging drives qualified leads, what segment of your customers are going to stick around, or what you need to kill tomorrow to save your cash. If you’re building a weekly system for marketing execution, it pairs well with a structured cadence like a weekly social media system.
This post provides a hands-on framework for identifying the vanity metrics in your business, replacing them with decision-useful metrics that require tradeoffs, and establishing an operating cadence that brings truth to light quickly. You will take away clear tests you can apply to any KPI, examples you can appropriate, and a process to keep your team focused on the small set of metrics that really influence revenue, retention and clean growth.
When it comes to startups, entrepreneurs should focus less on vanity metrics.
This is due to the fact that it creates an illusion of progress.
Vanity metrics help you quantify the number of users, website hits, signups, or even the number of downloads.
These metrics give you a sense of growth, though it might be an illusory one.
What is wrong with vanity metrics?
Vanity metrics make you aim at the wrong goal.
Optimizing for total signups and impressions incentivizes you to focus on acquiring users rather than retaining them, driving revenue, and lowering CAC.
It gets you busy with more acquisition campaigns, it shows more numbers to your investors, but it doesn’t help you focus on solving the hard challenges that make the business vulnerable: do users get activated, will they come back and will they generate enough revenue to make it worth acquiring the next user?
In order to have sustainable growth you need to focus on metrics that require sacrifice today, like increasing activation rate, lowering churn or payback period.
The most dangerous vanity metrics are the ones that trend up even as the company fails silently.
Signups can go up even as activation goes down, downloads can go up even as Day 7 retention goes flat, and followers can go up even as leads stay low quality.
GMV can look amazing in a marketplace even as take rate declines and support costs go through the roof.
MRR can look good until you add the missing context: churn, downgrades, refunds, and whether expansion revenue is outpacing those losses.
I have seen teams have a big MRR month and celebrate, only to learn the following month that they paid for it with discounts and pulled demand forward, then paid for it in churn.
Another suspect is the sum fallacy: sums are always going up, so they create an auto-narrative of success even as the core machine seizes.
A signups graph will climb forever even as the percent of users that hit the first aha moment decreases.
This is why you need to shift your analytics to rates and cohorts rather than sums:
- signups per week
- activation rate by channel
- retention curves by sign-up month
- gross margin per order
- net revenue retention
If you stop graphing sums and start graphing behavior over time, you’ll get to see whether the business is really learning and growing. For a deeper look at this mindset, you can compare it with how teams approach a social media audit.
In an early-stage startup, vanity metrics are expensive.
You focus on growth and performance rather than building something that’s sustainable.
You start hiring for growth, but when it’s too early, you don’t have time to retain.
You go into more markets, when you don’t know what works and what doesn’t.
You feel good when you shouldn’t and you wait until the cash is almost gone to do something about it.
Vanity metrics are bad for startups.
Find the metrics that really matter, and use them to measure the success of your team. If you need a simple way to quantify what actually matters on a channel, a tool like an engagement calculator can keep analysis grounded in interaction rates rather than raw totals.
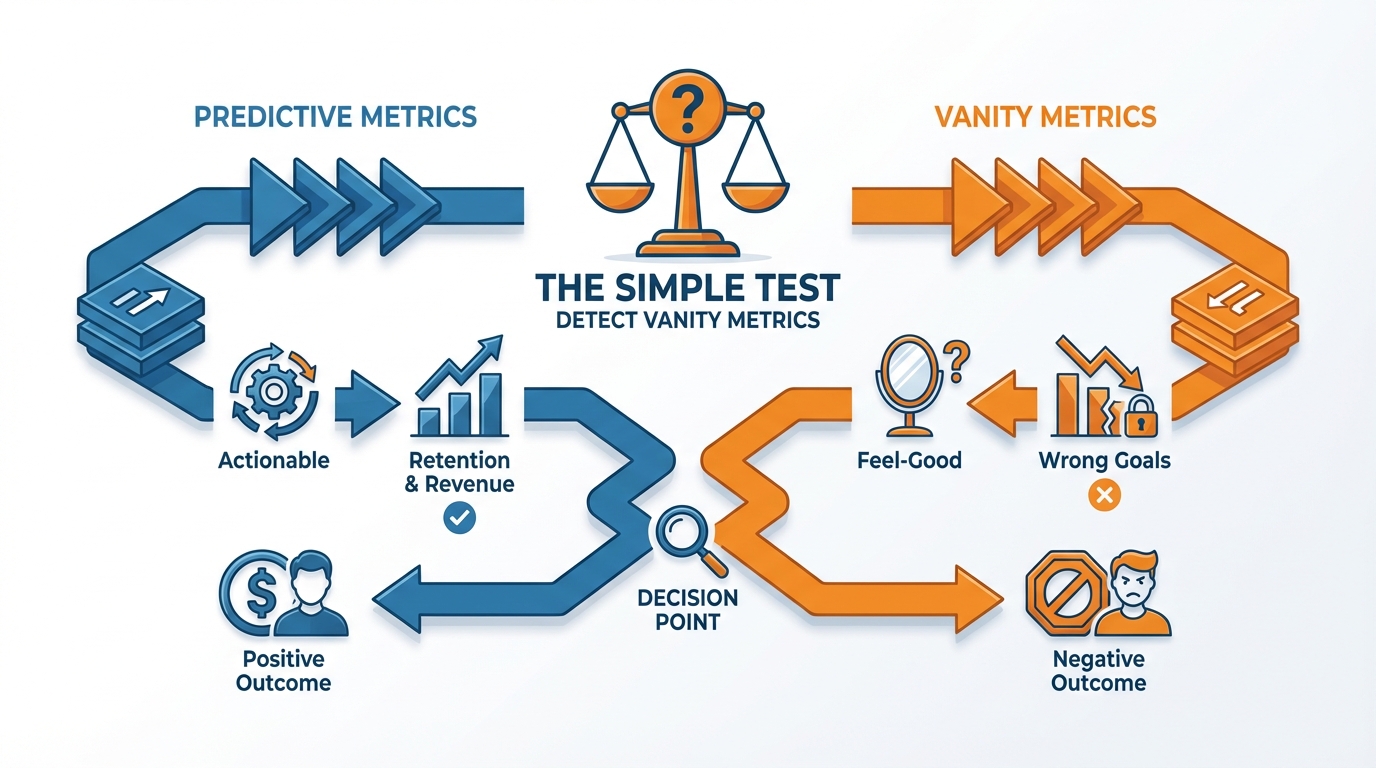
Why Startups Should Ignore Vanity Metrics by Using a Simple Test to Detect them Every Time
Before you jump to anoint a metric as a KPI, there’s a quick test you can apply.
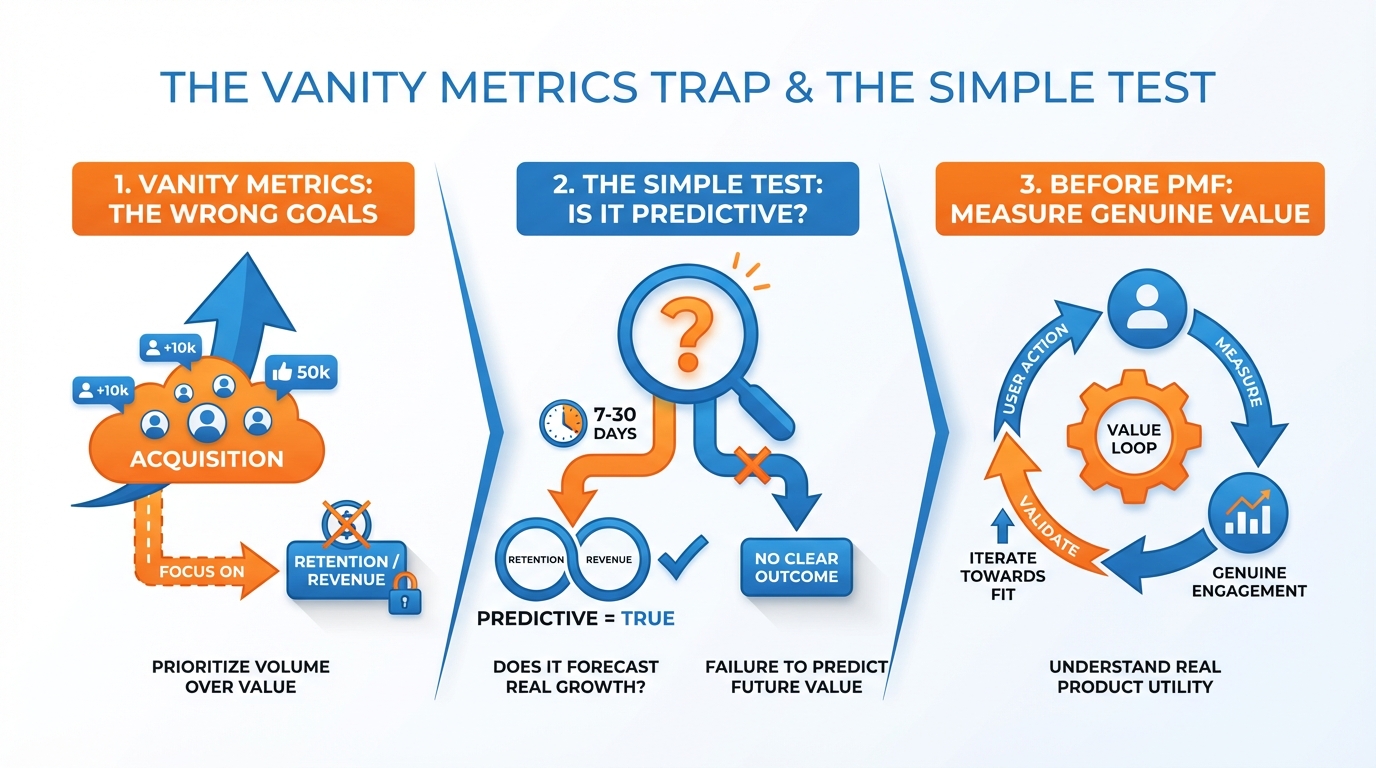
Ask yourself whether it is predictive: does it effectively predict retention and/or revenue over a time horizon that matters to your business (like 7-30 days if you’re in a lean startup)?
If it doesn’t predict next month’s cash flow, it’s just fun, not serious.
I’ve watched teams get excited about increases in traffic and followers, only to have retention and conversion rates next month remain exactly the same, with the business none the wiser.
Then check actionability and normalization, as these are where the majority of vanity metrics fall apart.
You should be able to put your finger on a team and say, you can move this in the next week or two, and we know which lever to pull.
If you can only change this by hoping it goes viral, or by spending more at the top of the funnel, it’s not actionable, it’s just a wish.
Then check if it’s a rate, not a raw total: per user, per cohort, per week.
Totals tend to trend up as you simply exist longer, which is why they’re so seductive.
You want things like activation rate by signup week, repeat purchase rate per customer cohort, or revenue per lead, because they force you to face whether the machine is truly getting better, not just louder.
Next, add two things that make the metric decision-grade: source control and anti-gaming.
It should be segmentable by channel, campaign, audience or cohort so you can say why it changed, not just that it changed.
If your metric pops but you can’t segment, you can’t reproduce it, and you can’t debug it when it breaks.
Lastly, see if the metric can be gamed without actually providing value.
If you can pump it up with tricks that don’t really enhance the customer journey, eventually you’ll feel it in churn, refunds, lower margins or support costs.
A good KPI makes it harder to cheat than do the actual work.
Here’s the subtlety.
Vanity metrics are not completely useless.
Many of them, if you describe what you’re measuring correctly and don’t let them dictate what you do, are still quite valuable.
That is, brand mentions, press coverage, number of partners, and other brand-building metrics are valuable for legitimacy, recruiting, and building other doors if you’re a young company who needs trust.
Measure them.
Trend them.
Tell stories with them.
Just don’t make decisions on them unless they are predictive, actionable, normalized, controlled and non-gamable.
If they can’t clear those hurdles, then they don’t belong on your weekly dashboard.
They should live on a PR or communications dashboard, not your weekly operating dashboard. A practical way to keep execution aligned with an operating dashboard is to maintain a social media content calendar.
Every startup goes through different phases of growth, which are more or less identical regardless of what business you are in.
It’s the metrics you measure and analyze which must change.
As much as I hate to hear myself say this, “it depends on the business model.” In all honesty, it does.
What is important to one business at the seed stage may be useless to another.
Finding the right set of metrics to measure can be challenging, and for that reason, every founder must find the right advisor(s) to help them in their business.
Vanity metrics are something every entrepreneur should avoid like the plague at all costs. One direct argument is that vanity metrics can be gamed and don’t predict revenue, including a case example of 10,000 app downloads followed by shutdown with 12 paying customers, as described in a rewritten title link to a handbook entry on avoiding vanity metrics.
What to measure before PMF
Understanding why vanity metrics are bad is trivial once you figure out what your company is trying to accomplish at this point in time, and measure that:
Before PMF, measuring your ability to deliver a genuine value loop to your users is far more valuable than measuring anything else.
The user of a certain type that you have, that experiences the first part of the value fast, and that comes back because they get value from it is your focus.
That means tracking quality of activation rather than signups, and retention (by cohorts) at day 1, day 7, day 30, frequency of your core value metric per week.
You should also be collecting reasons for churn religiously, as a simple insight like users churn because setting up takes 25 minutes is worth a month of pretty graphs at this stage.
The same is true for your acquisition metrics.
You need to optimize for cost per activated user instead of cost per lead, and also measure conversion-to-activation rates by source and time-to-value.
This is how small companies burn months: you can double leads from a channel and end up shrinking your business if it doesn’t activate or if it takes too long to realize value.
I have seen campaigns that looked like a success on cost per lead, but ended up being 5 to 10 times more expensive when measured on cost per activated user, once we got to the core value event.
Once you have reports organized this way, you can make quick decisions like shutting down a channel that is high volume and high time-to-value or rewriting onboarding so that it takes one session instead of three to activate.
What comes after PMF?
After PMF, your job is to figure out how to scale without fucking it up.
As of now, your unit economics should be the rails on the track - keep your eyes on CAC payback, contribution margin, and LTV:CAC (and articulate all your assumptions, because it only takes one off assumption to make what looks like a great ratio turn into a landmine).
Your top-line metrics should track how you monetize - for SaaS, that will be churn, expansion, net revenue retention, for B2C it will be repeat rates and cohort margin, for marketplaces it will be liquidity and fulfillment health (and take rate and refunds, because GMV can go up and your business can be falling apart underneath it).
If your growth is growing payback, squeezing margin, or increasing churn, you are not scaling - you are digging a hole and moving the dirt over your own grave. For retention context, one benchmark report notes that increasing NRR from 90-100% to 100-110% improves growth rate by ~5 percentage points, in a rewritten title link to private B2B SaaS growth benchmarks.
The reason most generic advice isn’t helpful is because it doesn’t account for the complexity of your business model, so you need to focus on the few metrics that actually describe your path to market.
If you’re sales-led B2B, then you don’t care about pipeline velocity or win rate unless you have a direct way to measure how those numbers relate to quality-of-customer; otherwise, meeting volume is just a vanity metric that lets you mask low close rates and churn.
If you’re product-led then activation and PQL-to-paid conversion are far more valuable to you than DAUs because DAUs are just noise if you don’t have a clear picture of retention and revenue per cohort.
If you’re a marketplace then your weekly operating view should be about liquidity and repeat rates because GMV isn’t going anywhere good if take rate drops or refunds rise.
You have to adjust your mindset to the idea that you have numbers for the world to see and you have numbers to run the business and you have to have the confidence to not show the latter.
I’ve written about why instrumenting the funnel is crucial for startups, but it can be challenging to balance between vanity metrics and actionable metrics. If you want related thinking on execution, see smart social media automation for an example of building repeatable systems instead of chasing spikes.
In practice, it means startups should focus on metrics that are actionable.
Here’s how I think you can run a weekly metric rhythm.
A weekly metric rhythm (instrument the funnel)
Why startups should ignore vanity metrics is pretty clear once you instrument your funnel correctly, because instrumentation makes it difficult to play metric theater.
To instrument your funnel, first define your north-star action to be some single measured event that signifies the point at which your customer receives value, as opposed to an event that signifies the point at which your customer shows some intent to consume your value.
If you are a local services marketplace, perhaps it’s a request including budget and timeline.
If you are a SaaS company, perhaps it’s the first successful setup that produces a real output.
Then, build a coherent, persistent event taxonomy so that activation and retention mean the same thing next month as they do today, as event definitions are the most likely mechanism by which teams generate false growth.
Finally, default to cohort views by signup week or month, channel, and segment as opposed to looking at totals, since totals are essentially designed to always increase as long as you simply stay alive, whereas cohorts are the primary way to force yourself to confront the question of whether today’s customer is doing better than last week’s customer.
By instrumenting your funnel, you can distinguish leading from lagging indicators and quit mistaking noise and marketing for progress.
I consider activation rate, time-to-value, onboarding completion rate, and qualified engagement to be leading because they tend to move first and because they are generally things you can fix within days; and I consider revenue, churn, and expansion to be lagging because they only confirm what has already happened.
It is important to tie the indicators together so that growth in the leading indicators always means better outcomes, rather than just more noise: you should track each acquisition channel to cost per activated customer, and then connect activation to week-4 retention, and connect week-4 retention to revenue per cohort.
I have seen a campaign increase leads by 100% while weakening the business because time-to-value increased from 1 day to 2 weeks; the top of the funnel was partying, but the cohort revenue curve was quietly imploding. That’s also why investor-facing views emphasize retention and efficiency: one roundup lists Net Dollar Retention ranges such as Outlier >100% for top-decile Series A metrics, in a rewritten title link to B2B SaaS benchmarks.
For accountability, use a weekly metric cadence that is designed for motion and education, not reporting.
Your weekly review should be able to answer what moved, why did it move, and what are we going to change this week to move it some more.
By forcing the discussion to be about levers and experiments, you cease doing meetings where you just stare at graphs and instead enter into a fast cycle of hypotheses -> actions -> measured results.
This is particularly important for a small business because you don’t have the cash to burn to find out a quarter from now that some acquisition channel you have been riding is bringing in the wrong kind of customer.
Make the frequency compulsory and play by a set of rules.
Each metric needs to have an owner, a lever to pull and a backlog of experiments that can be run within a week.
Further, make sure you put an impenetrable moat between this week’s work and the slippery slope of useless metrics: lump all of your impressions, followers, clicks and lead generation in the “context” section.
This should be a set of metrics that explain how you got to your week’s work, but can’t be used as leverage.
It’s not that you shouldn’t see them, it’s that you don’t let them win a debate.
Only your proxies for value to customers and repeatable economics are allowed to win a debate and get your week.
Em conclusão
The reason startups should avoid vanity metrics is simple and frightening: vanity metrics are not necessarily bad things.
They are just weak indicators and so easy to manipulate that they are the wrong choices to steer by.
A metric that is always going up can still conceal problems in activation, retention, margin, or support load that will kill you, so find ways to track those underlying metrics.
If you need a metric to terrify you into caring about accuracy, consider this: a wide variety of studies have estimated that about 70 percent of venture-backed startups are failures, and it’s almost never because not enough users viewed their page; it’s because they never managed to reach profitability and retention. In a rewritten title link to a CNBC report on why startups failed, one cited data point is that 47% of startup failures in 2022 were due to lack of financing/investors (per CB Insights data cited by CNBC): why startups failed in 2022.
Your part is very hands-on: wherever you see impressive numbers, insert useful numbers instead.
When you are going through your numbers, require that each number answer a simple yes or no question in prose, like: “Should we invest more heavily in this marketing channel?” or “Should we fire this offer?” or “Should we fix this broken onboarding step?” or “Should we increase the price?”
If a number does not affect anything you’ll do this week, or if it doesn’t predict your retention and cash flow 30 to 90 days from now, it’s a context metric, and you need to stop letting it win any arguments.
This alone can save tiny startups from frittering away our most precious resources on growth that goes fast, but whose customers never stick around.
First, for this to be actionable, your scoreboard has to be based on a value loop and unit economics, not volume.
You want to be able to measure activation-to-week-4 retention by cohort, revenue per activated customer, gross margin (after considering delivery costs), and CAC payback period, because these highlight trade-offs early on.
If there’s one operational rule you need to remember, it is this: whenever a metric is improving, but cost per retained customer is increasing, and refund rate is increasing, and contribution margin is declining, you are not scaling, you are renting growth.
I’ve seen teams celebrate leads and traffic going up, only to realize weeks later that time-to-value had crept up quietly, and churn had crept up right after it. If you need a quick gut-check for misleading headline growth, a rewritten title link highlights an example where going from $1 to $5 is “500% growth” but may be meaningless without scale context: why this vanity metric misleads startups.
I don’t dismiss vanity metrics to be some sort of a hipster.
I do it to focus the team on retention, value and unit economics, which are the things that, if you’re a startup, are the only things that can keep you breathing.
You still measure reach and views if that’s important to awareness and credibility, but you only run your business on decision-grade metrics that are predictive, actionable, normalized and hard to game.
If you do that, reporting isn’t a performance; it’s a tool.
It tells you when to pivot before your bank account does.
Related reads
4/27/2026
B2B SaaS social media benchmarks: Set the right targets.
B2B SaaS social media benchmarks: Set the right targets. The trouble with defining B2B SaaS social media benchmarks is that it's an inherently impe...
4/25/2026
Building a personal brand as a technical founder (without becoming a creator)
Building a personal brand as a technical founder (without becoming a creator) Creating a personal brand as a tech founder should feel less about ma...
4/20/2026
Creative Post Ideas for Sustainable Brands (That Don’t Sound Greenwashy)
Creative Post Ideas for Sustainable Brands (That Don’t Sound Greenwashy) That’s not what creative post ideas for sustainable brands should look lik...